Note
Go to the end to download the full example code.
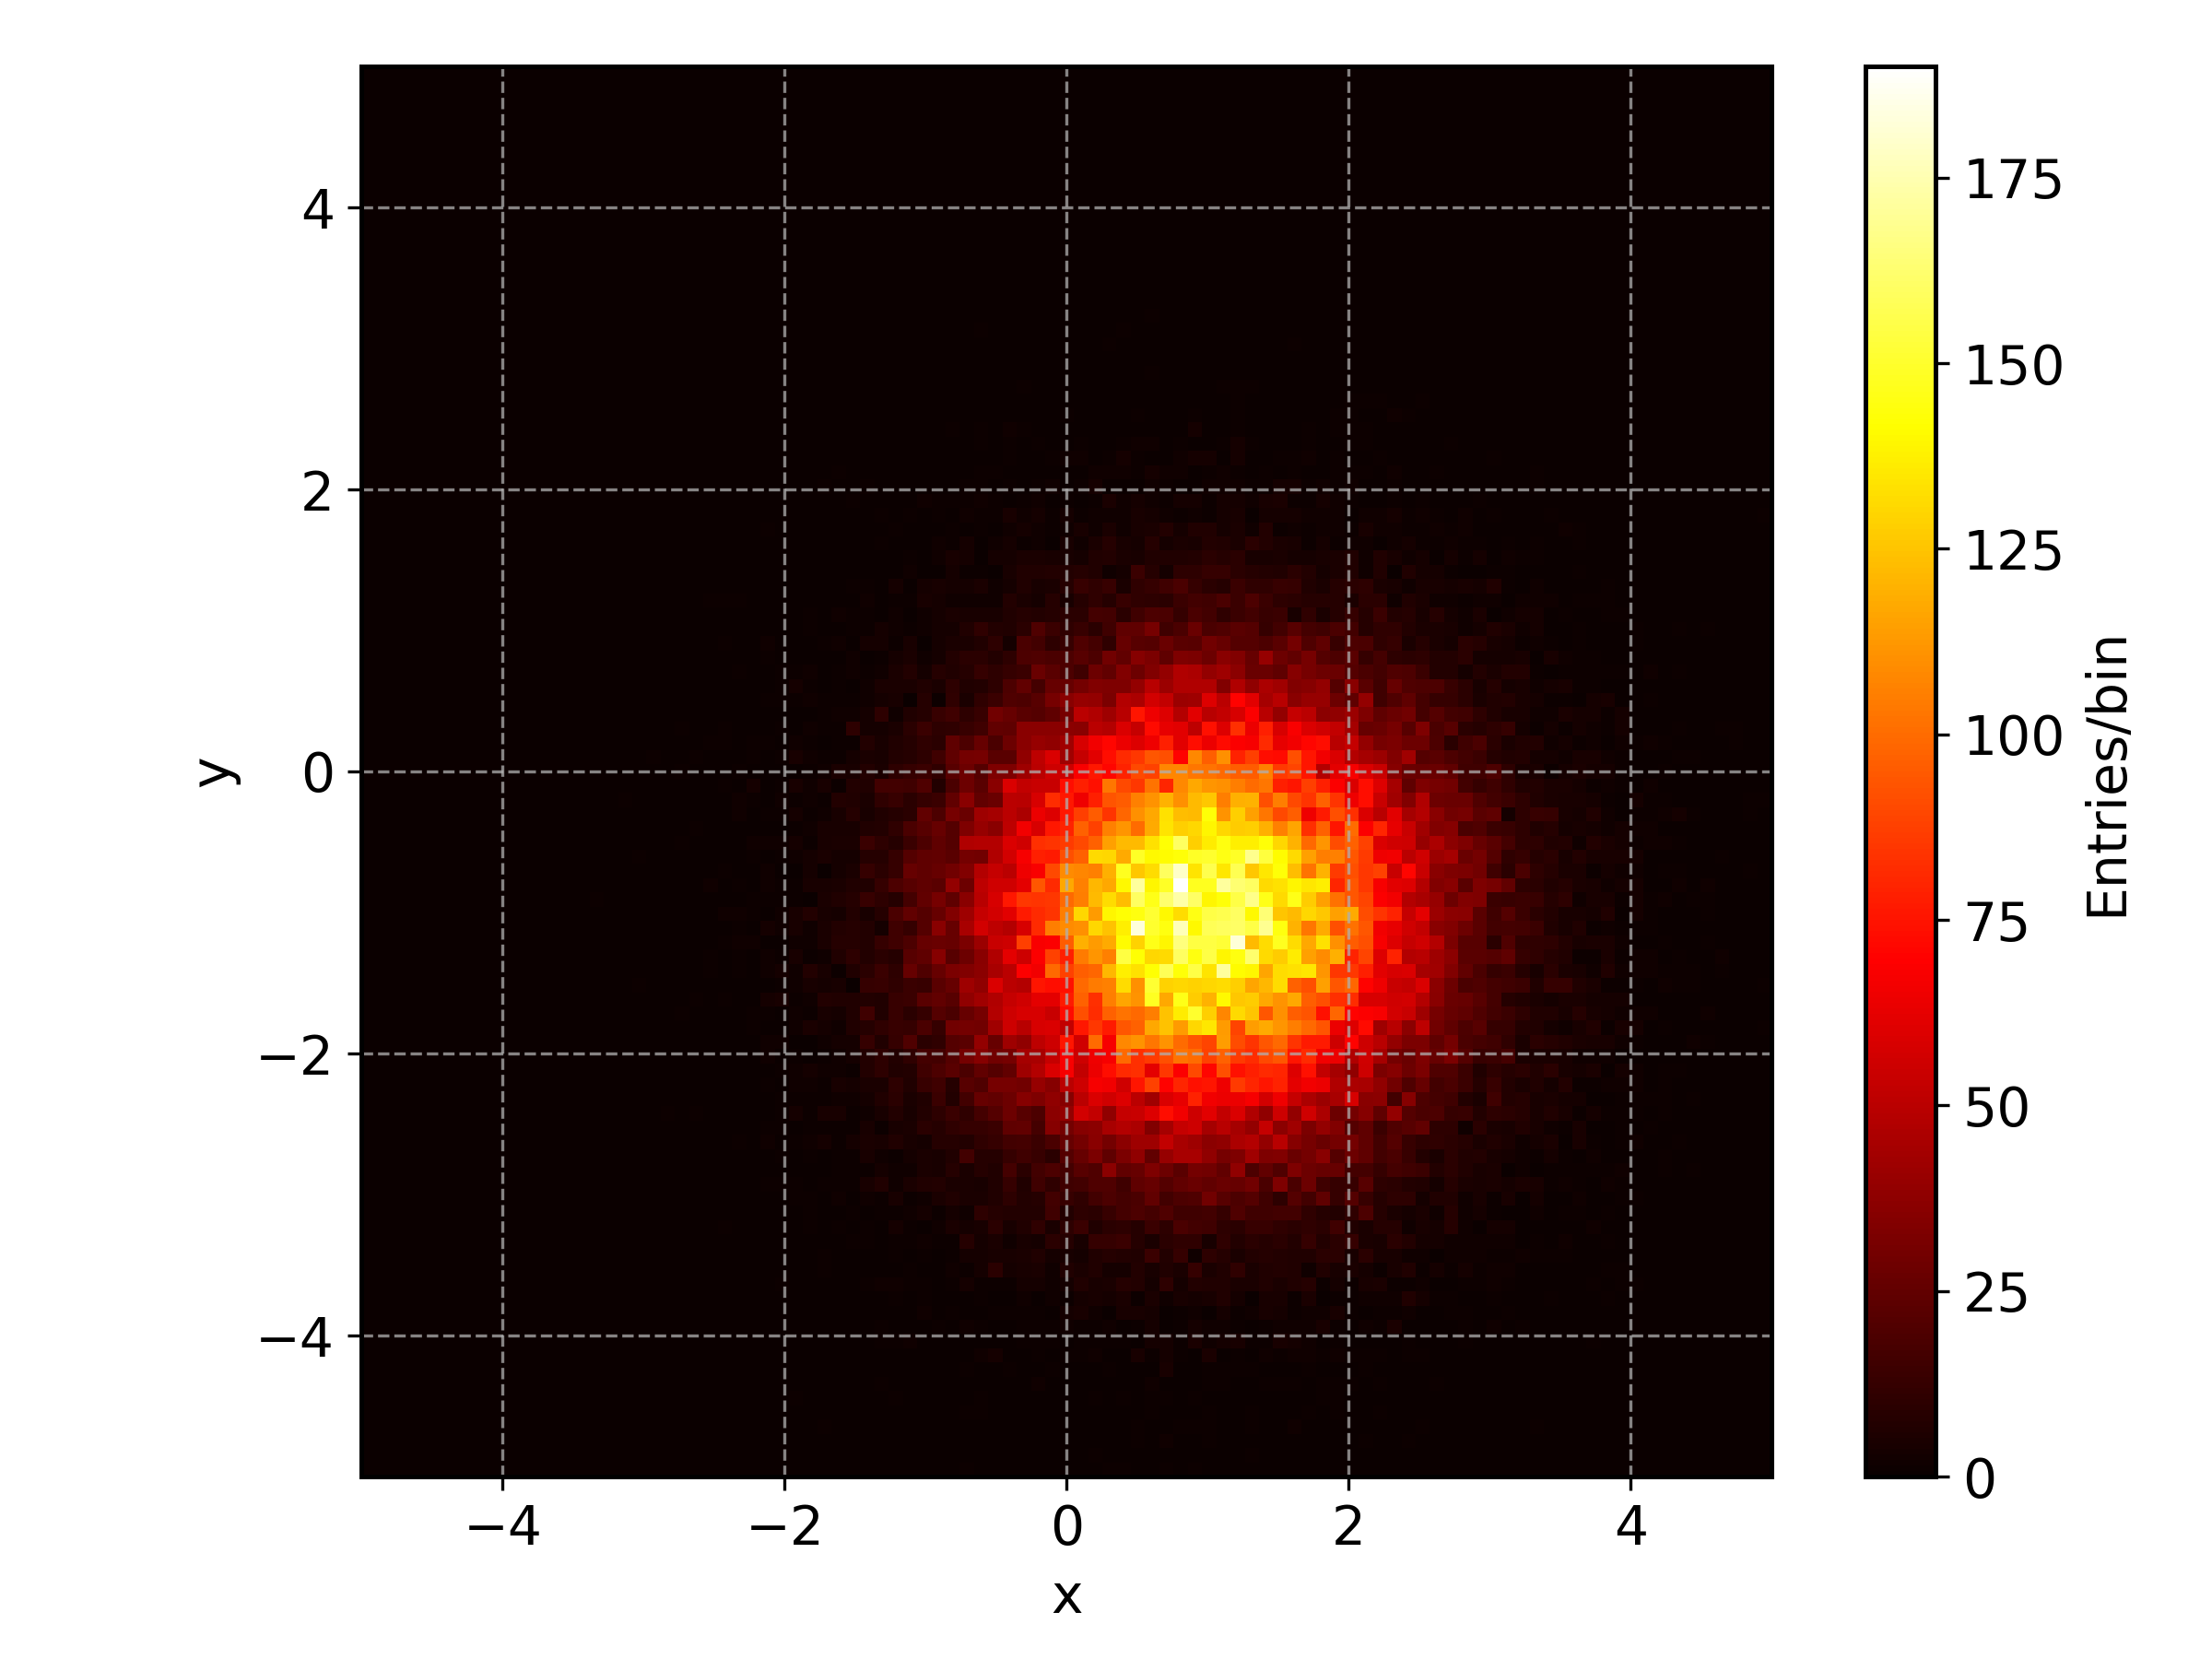
Simple 2-D histogram#
Simple two-dimensional histogram filled with bivariate gaussians random numbers.
import numpy as np

from aptapy.hist import Histogram2d
from aptapy.plotting import plt

edges = np.linspace(-5., 5., 100)
hist = Histogram2d(edges, edges, label="Random data", xlabel="x", ylabel="y")
x= np.random.default_rng().normal(loc=1., size=100000)
y= np.random.default_rng().normal(loc=-1., size=100000)
hist.fill(x, y)
hist.plot()

plt.gca().set_aspect("equal")
Total running time of the script: (0 minutes 0.226 seconds)