Note
Go to the end to download the full example code.
Simple fit#
Simple gaussian fit to histogram data.
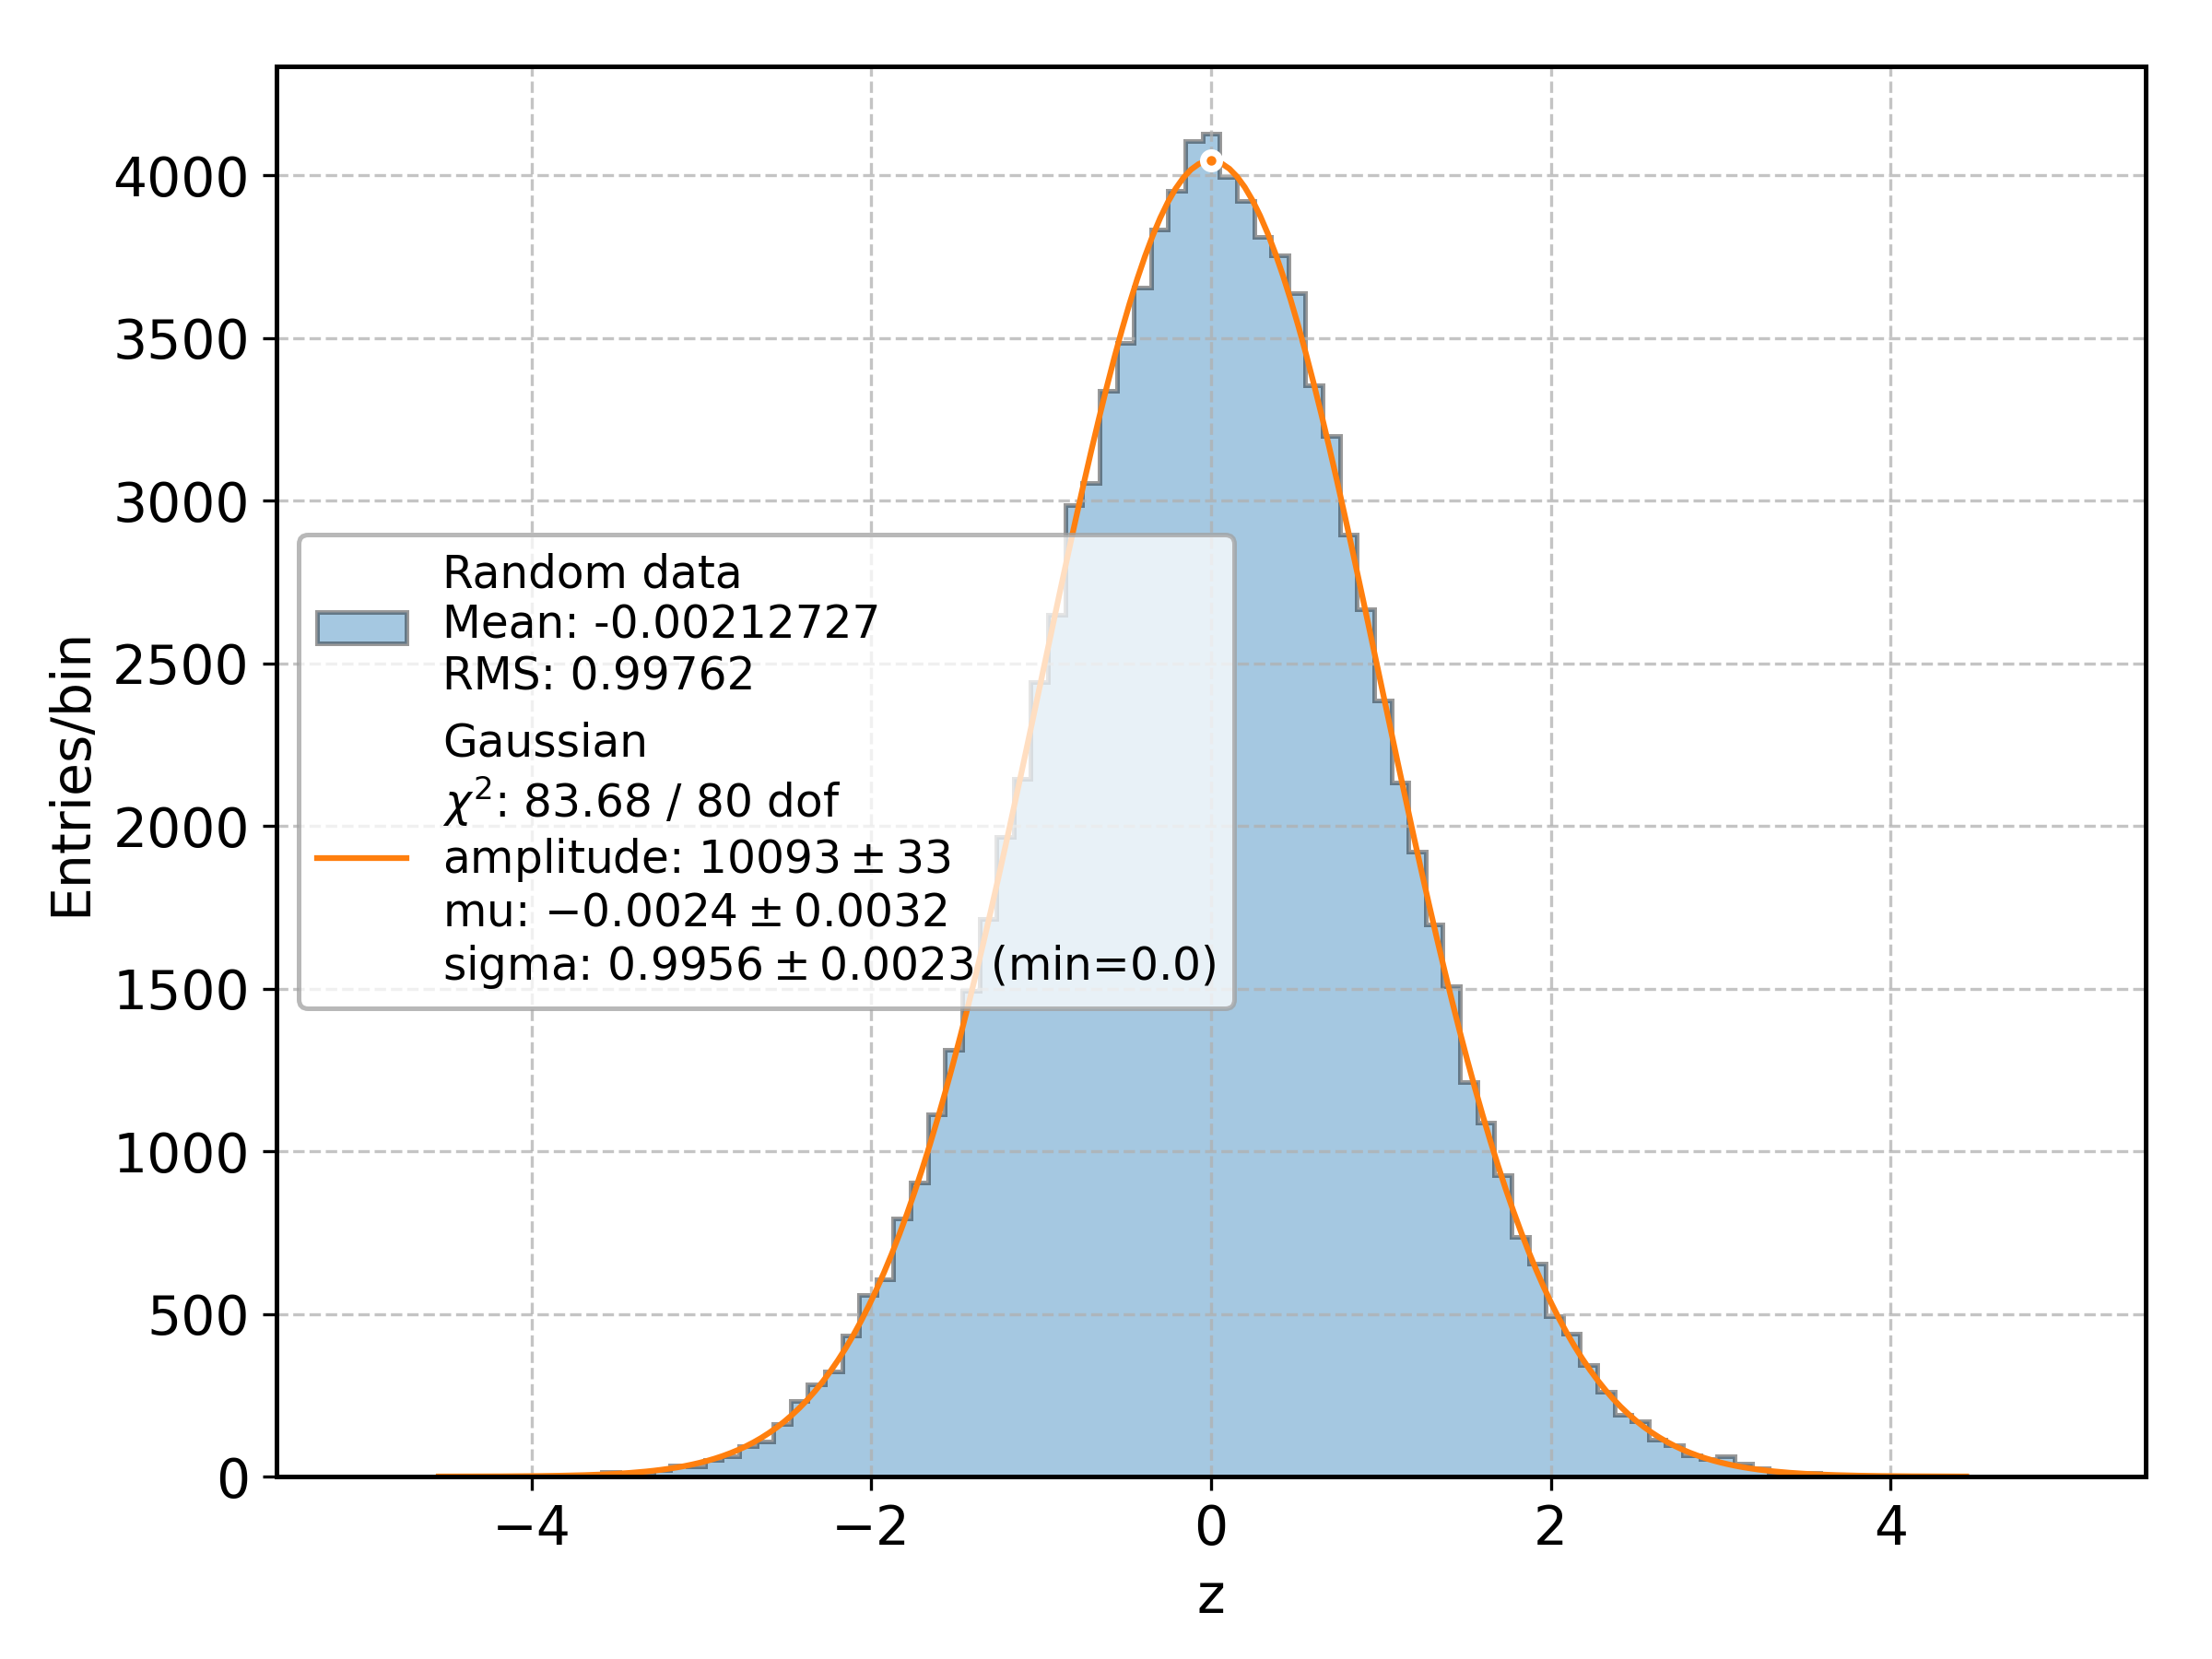
Gaussian
χ²: 61.83 / 81 dof
amplitude: 10095±28
mu: -0.0034±0.0028
sigma: 1.0022±0.0020 (min=0.0)

<matplotlib.legend.Legend object at 0x7fb7d1e21d90>
import numpy as np

from aptapy.hist import Histogram1d
from aptapy.models import Gaussian
from aptapy.plotting import plt

hist = Histogram1d(np.linspace(-5., 5., 100), label="Random data", xlabel="z")
hist.fill(np.random.default_rng().normal(size=100000))
hist.plot(statistics=True)

model = Gaussian()
model.fit(hist)
print(model)
# Plot the model, including the fit output in the legend.
model.plot(fit_output=True)

plt.legend()
Total running time of the script: (0 minutes 0.270 seconds)