Note
Go to the end to download the full example code.
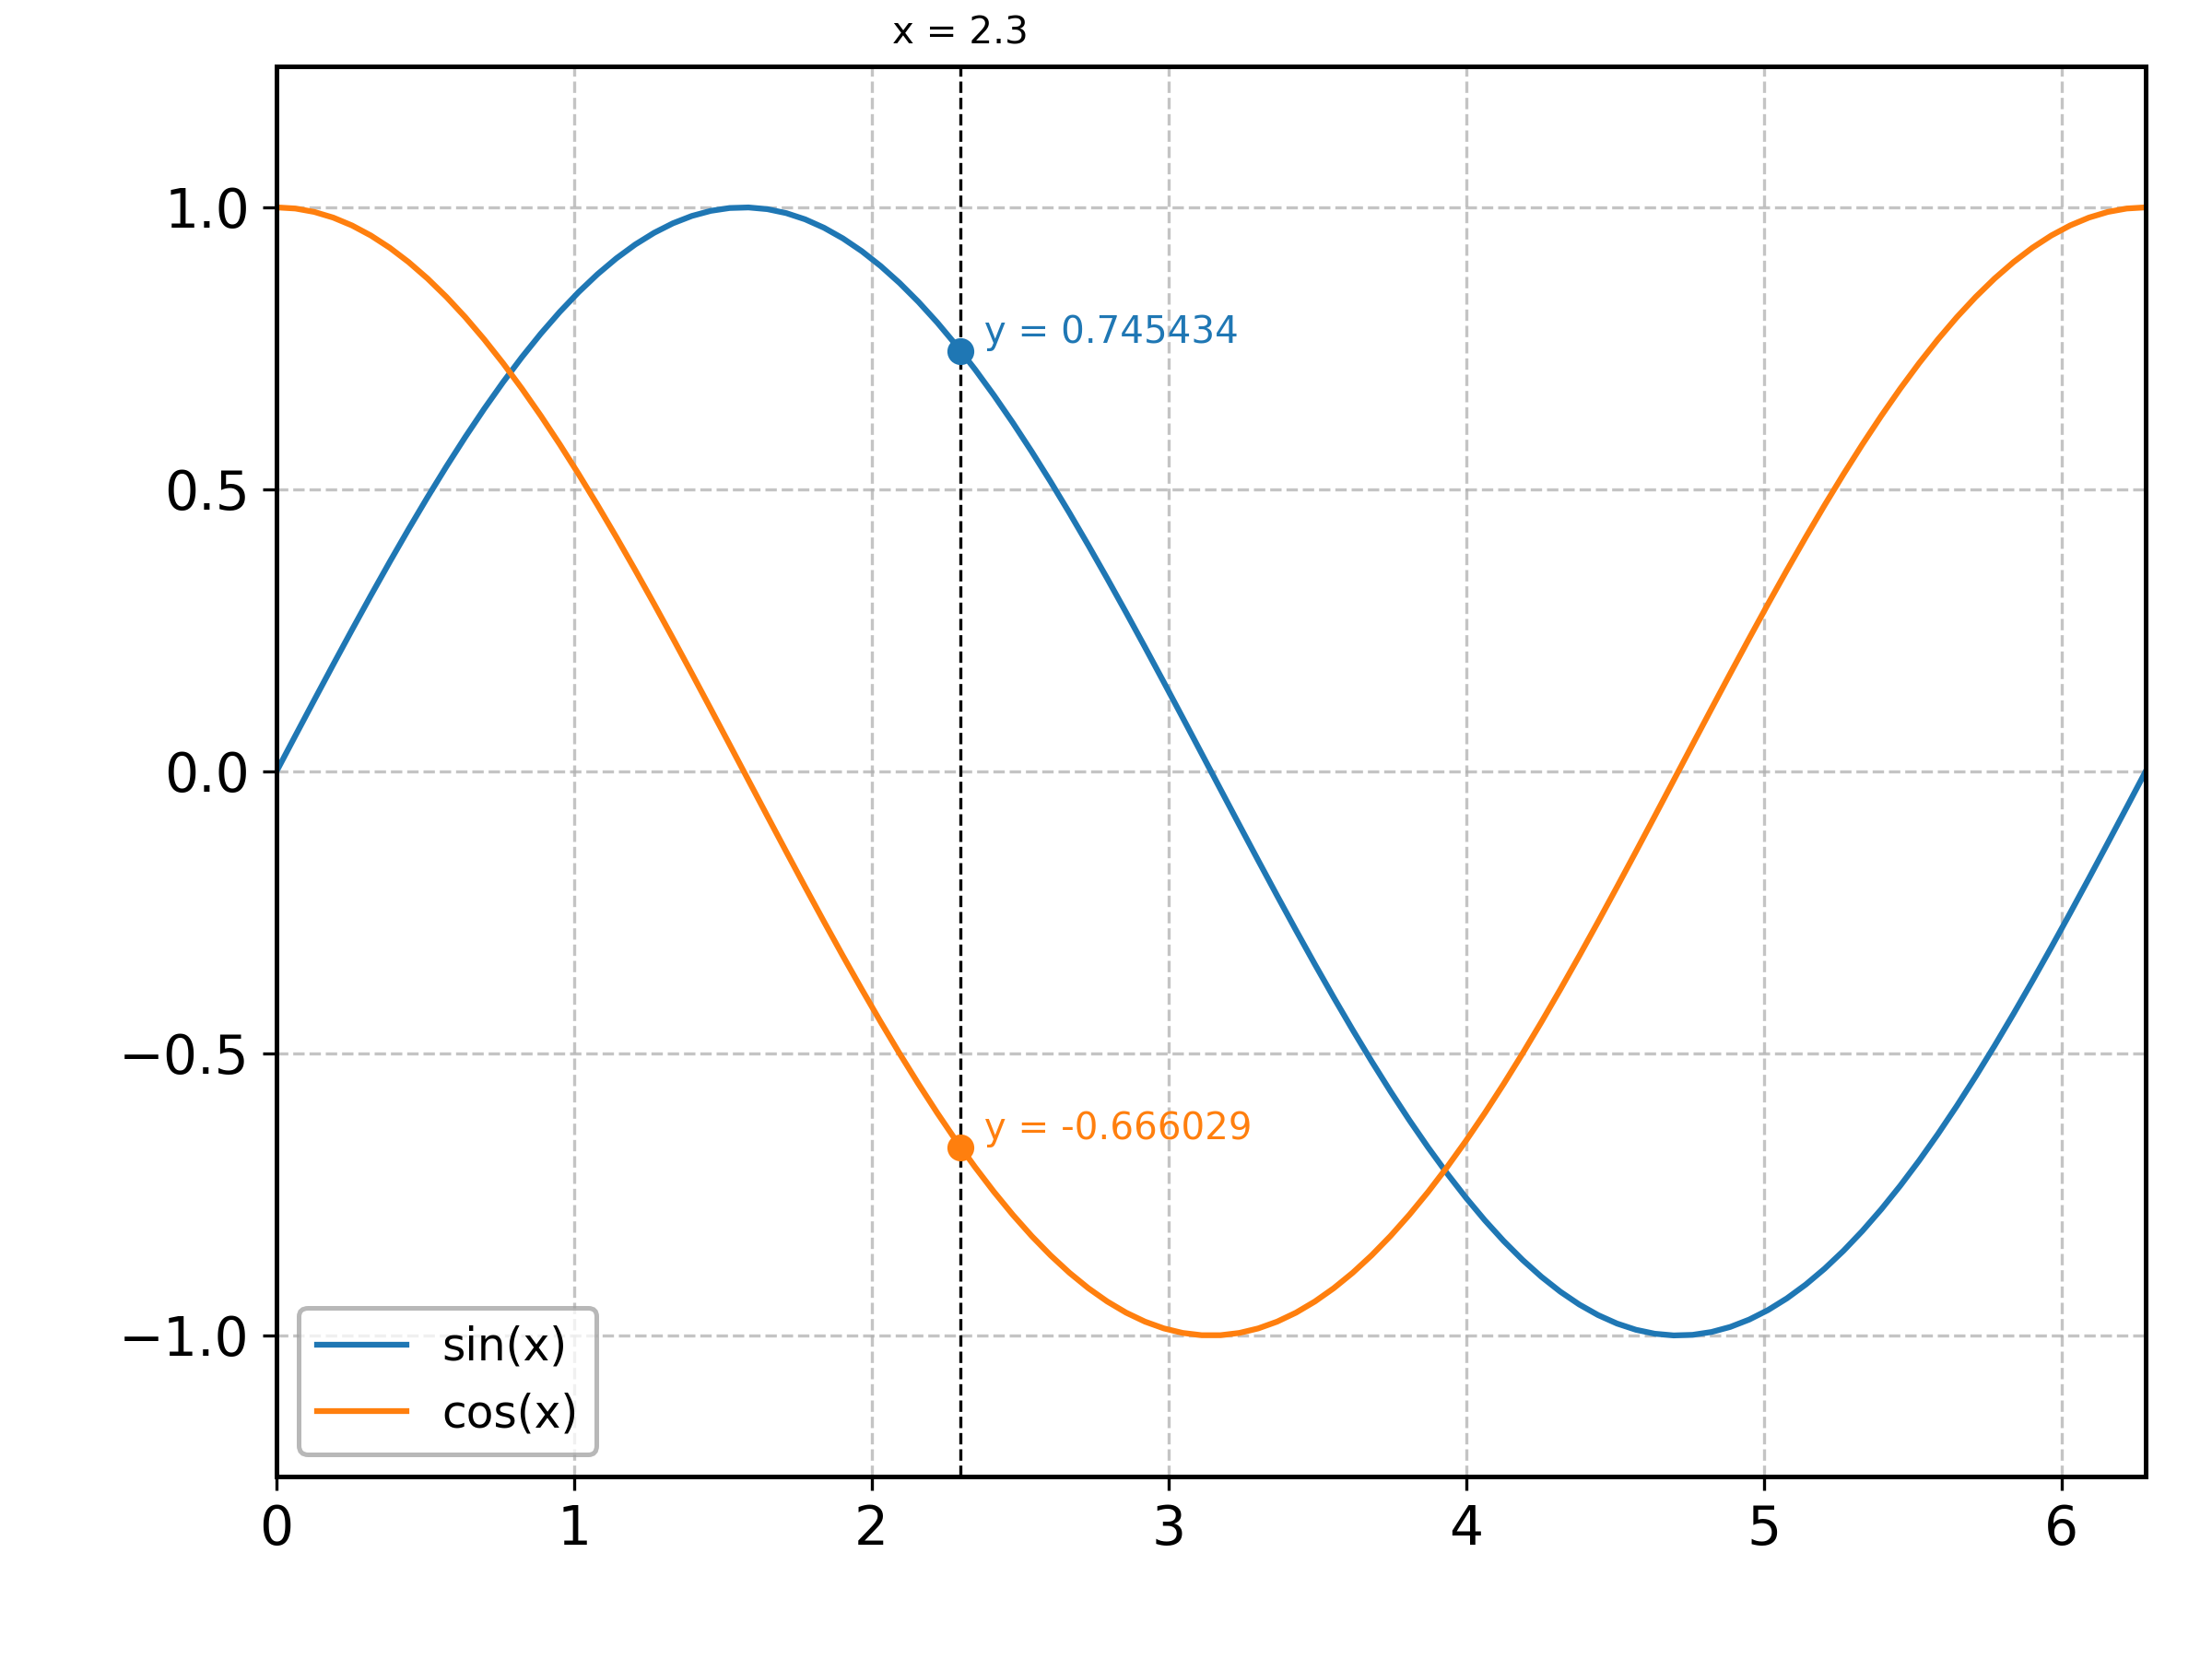
Interactive cursor#
Interactive cursor to zoom and retrieve data from one or more plottable objects.
<matplotlib.legend.Legend object at 0x7fb7d2209220>
import numpy as np

from aptapy.plotting import VerticalCursor, plt, setup_gca
from aptapy.strip import StripChart

x = np.linspace(0., 2. * np.pi, 100)

# Create a cursor object,
cursor = VerticalCursor()

# Create a strip chart and plot it...
chart1 = StripChart(label="sin(x)").put(x, np.sin(x))
chart1.plot()
# ...and then add the corresponding marker to the cursor. Note that if you
# plot first and then immediately add the cursor, then the color is picked
# up automatically.
cursor.add_marker(chart1.spline())

# Same thing for the second strip chart.
chart2 = StripChart(label="cos(x)").put(x, np.cos(x))
chart2.plot()
cursor.add_marker(chart2.spline())

# Setup the plot.
setup_gca(xmin=0., xmax=2. * np.pi, ymin=-1.25, ymax=1.25)

# Set the cursor visible and move it to a given x-position for the purpose
# of creating this plot...
cursor.set_visible(True)
cursor.move(2.3)

# ... while in real life you would just activate it, and it would simply
# follow the mouse.
#cursor.activate()

plt.legend()
Total running time of the script: (0 minutes 0.211 seconds)