Note
Go to the end to download the full example code.
Epoch strip chart#
Strip chart where the values on the x-axis are seconds since the Unix epoch.
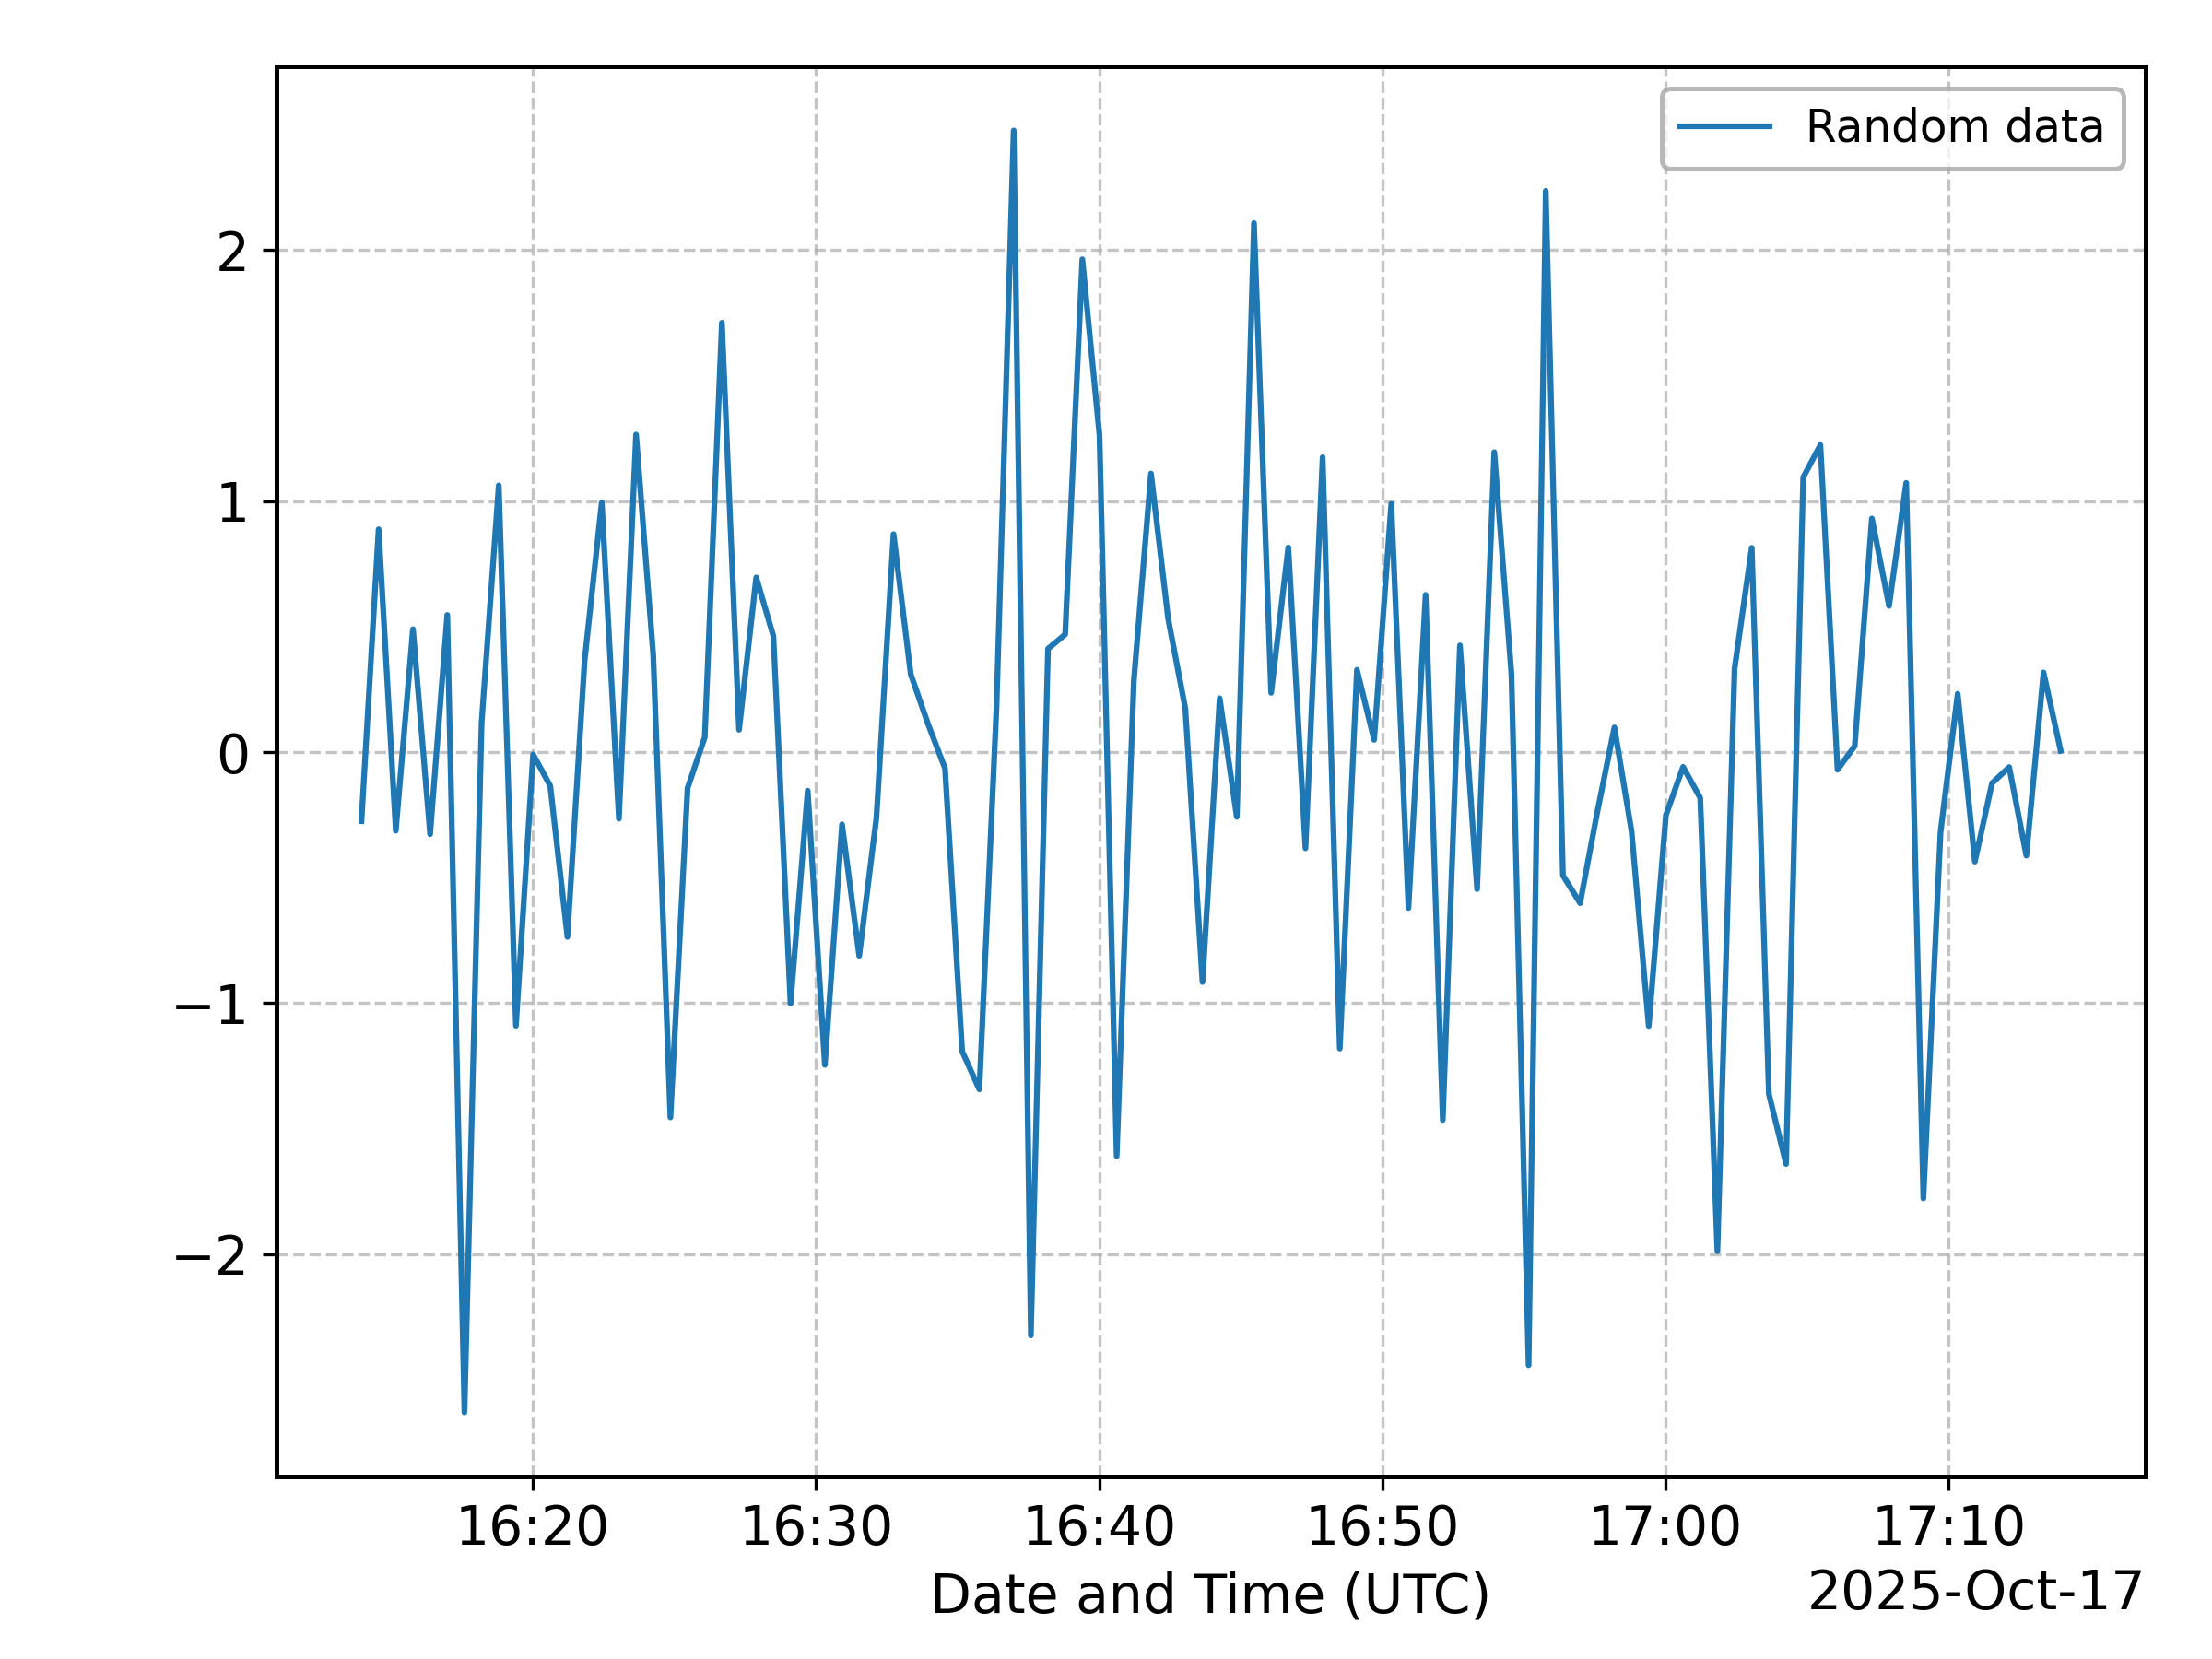
<matplotlib.legend.Legend object at 0x7fb7d23714c0>
import numpy as np

from aptapy.plotting import plt
from aptapy.strip import EpochStripChart

t0 = 1760717637
t = np.linspace(t0, t0 + 3600., 100)
y = np.random.normal(size=t.shape)

chart = EpochStripChart(label="Random data").put(t, y)
chart.plot()

plt.legend()
Total running time of the script: (0 minutes 0.216 seconds)