Note
Go to the end to download the full example code.
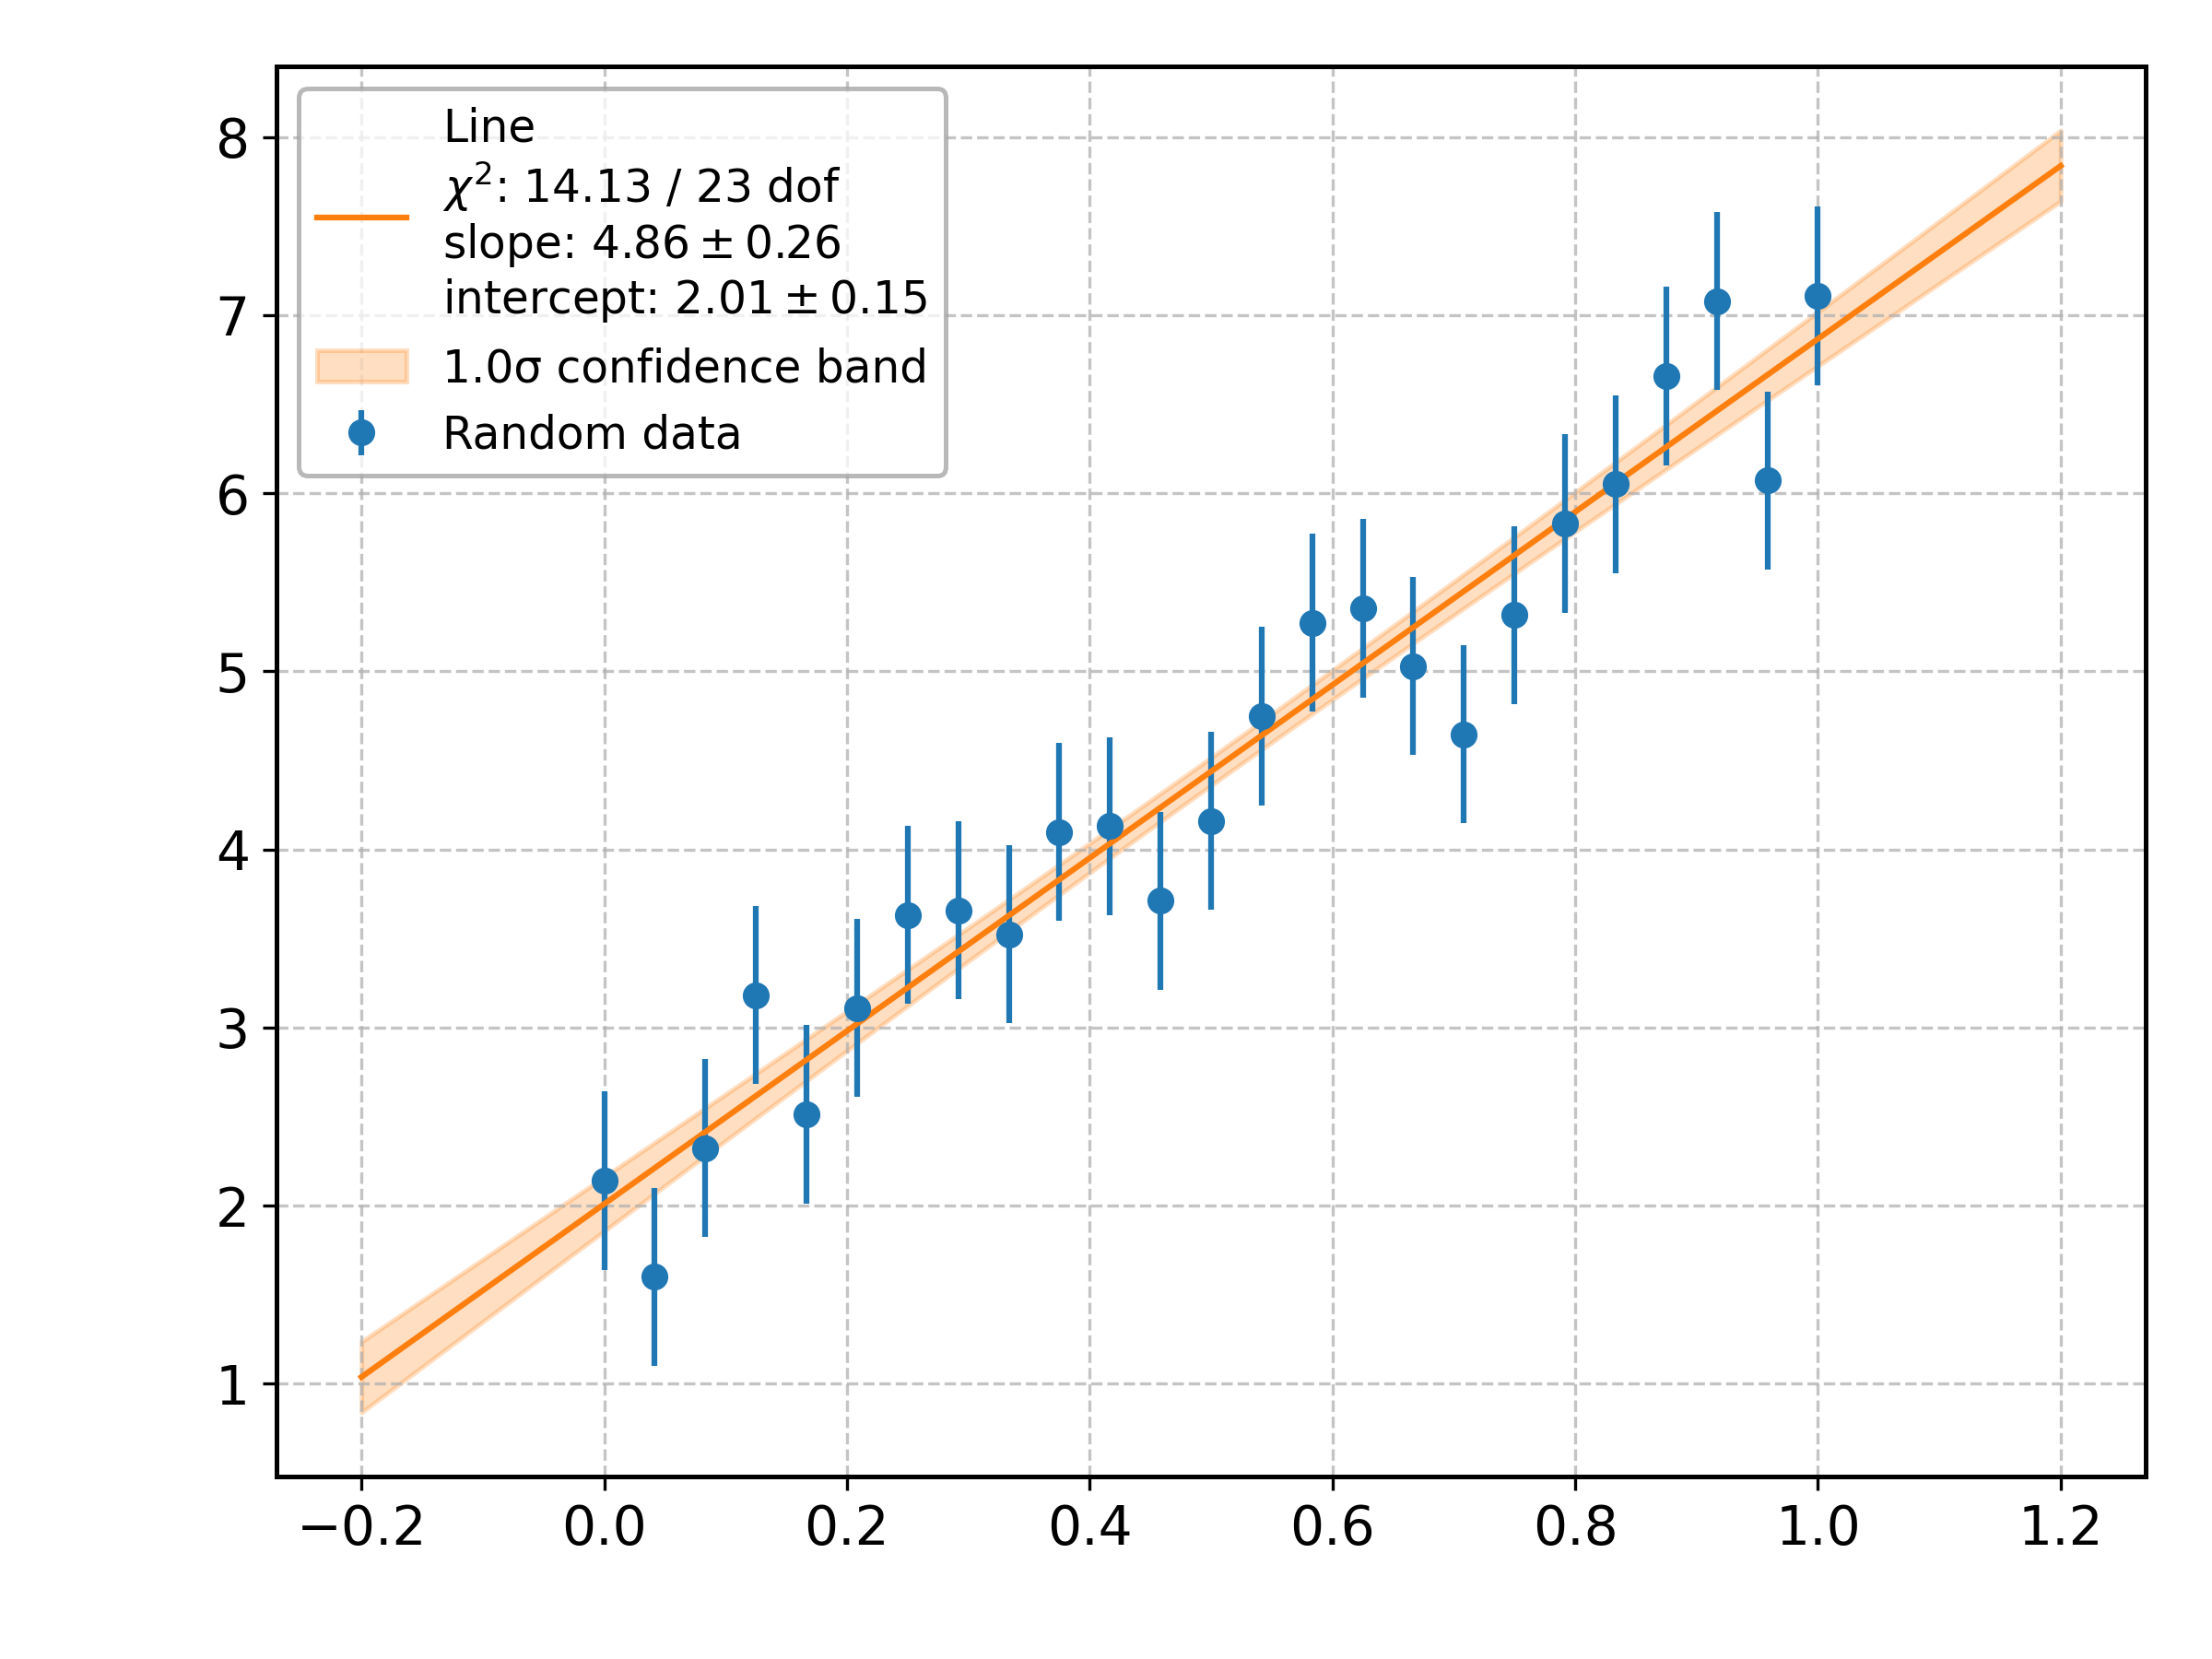
Confidence band#
Plotting a one-sigma confidence band around the best-fit model.
<matplotlib.legend.Legend object at 0x7fb7d25976b0>
from aptapy.models import Line
from aptapy.plotting import plt

sigma = 0.5
model = Line()
model.set_parameters(5., 2.)
xdata, ydata = model.random_fit_dataset(sigma)
plt.errorbar(xdata, ydata, sigma, fmt="o", label="Random data")
model.fit(xdata, ydata, sigma=sigma)
model.set_plotting_range(-.2, 1.2)
model.plot(fit_output=True)
model.plot_confidence_band()

plt.legend()
Total running time of the script: (0 minutes 0.283 seconds)