Note
Go to the end to download the full example code.
Composite fit#
Composite fit with a Gaussian plus a straight line.
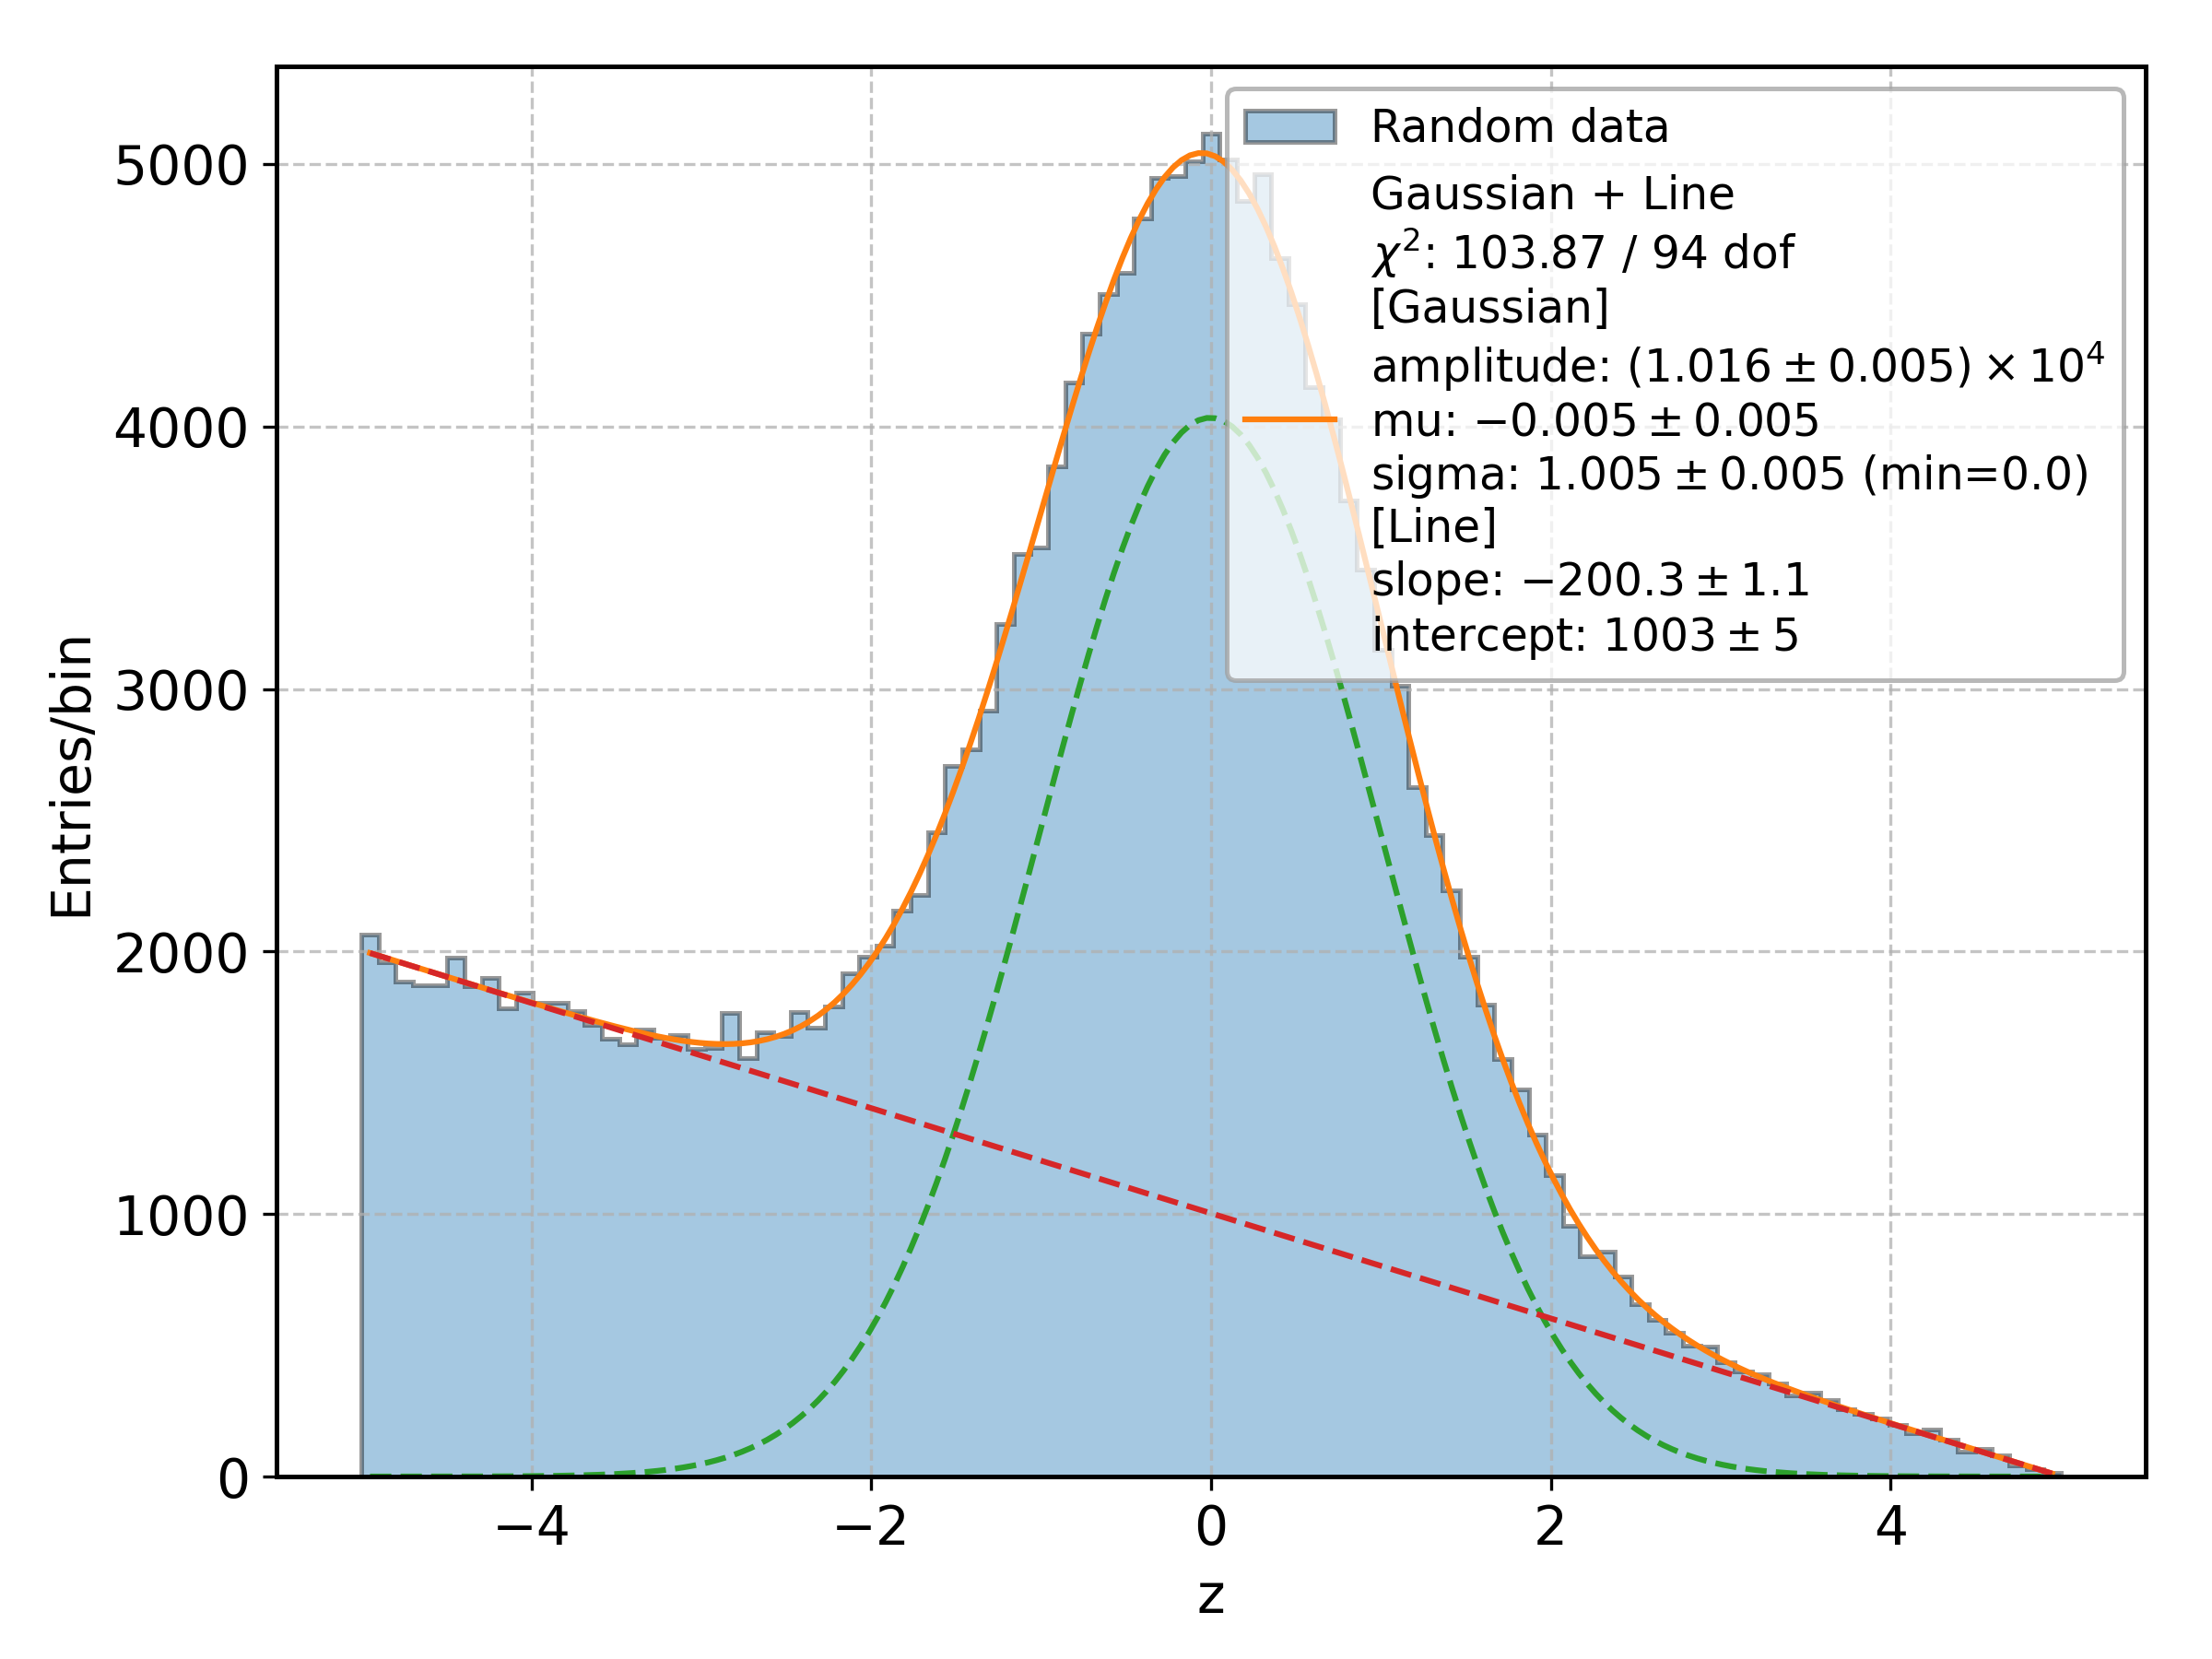
Gaussian + Line
χ²: 114.34 / 94 dof
[Gaussian]
amplitude: (1.006±0.005)×10⁴
mu: -0.002±0.005
sigma: 0.993±0.005 (min=0.0)
[Line]
slope: -203.3±1.1
intercept: 1013±5

<matplotlib.legend.Legend object at 0x7fb7d241dfd0>
import numpy as np

from aptapy.hist import Histogram1d
from aptapy.models import Gaussian, Line
from aptapy.plotting import plt

hist = Histogram1d(np.linspace(-5., 5., 100), label="Random data", xlabel="z")
# Fill with the sum of a gaussian...
hist.fill(np.random.default_rng().normal(size=100000))
# ... and a triangular distribution (this is done via the inverse transform method).
hist.fill(5. - 10. * np.sqrt(1 - np.random.default_rng().random(100000)))
hist.plot()

model = Gaussian() + Line()
model.fit(hist)
print(model)
model.plot(fit_output=True)

plt.legend()
Total running time of the script: (0 minutes 0.351 seconds)